TL;DR
Sovereign AI infrastructure monitoring uses locally deployed large language models (LLMs) to reason over telemetry from networks, GPUs, storage, Kubernetes, and security systems. Instead of exporting logs or relying on dashboards alone, on-prem LLMs correlate cross-domain signals, generate evidence-backed incident narratives, and recommend auditable, human-approved remediation, reducing mean time to resolution while keeping operational data inside the customer boundary.
Key outcomes: faster root cause analysis, reduced alert noise, safer remediation, and full data sovereignty.
Why Infrastructure Monitoring Breaks Down in AI Environments
AI platforms don’t fail politely.
One day everything looks stable, links are up, dashboards are green, and GPU utilization is high, while performance quietly degrades.
The challenge is no longer collecting telemetry. Enterprises already stream metrics, logs, and events from every layer of the stack. The real problem is turning those signals into an explanation fast enough to act.
Locally deployed LLMs address this gap by acting as a reasoning layer above existing monitoring tools. Running inside the customer boundary, they correlate signals across network, GPU, storage, Kubernetes, and security domains, and produce evidence-backed explanations with clear remediation paths.
This post takes a practical look at how customers use local LLMs to monitor modern AI infrastructure spanning multiple networks: GPU fabrics, management and storage planes, and out-of-band access, where incidents cross domains and correlation matters more than another dashboard.
LLMs don’t “monitor” they reason over monitoring
Traditional monitoring is excellent at detecting threshold breaches. It can tell you a link went down, CPU is high, or a latency SLO is violated. What it doesn’t do well is explain causality: what changed, what’s impacted, and what the safest next step is. In high-pressure moments, operators don’t need more charts. They need a narrative they can trust and a plan they can execute.
A locally deployed LLM can help bridge that gap, but not by reading raw counters like a human. The best results come when you treat the model like an analyst who has access to tools. The LLM should be able to query your telemetry stores, retrieve your internal runbooks and architecture docs, and then produce structured conclusions that clearly separate facts from hypotheses. Done right, the model becomes less of a chatbot and more of a disciplined reasoning engine.
A reference pattern: Telemetry → Meaning → Reasoning → Action
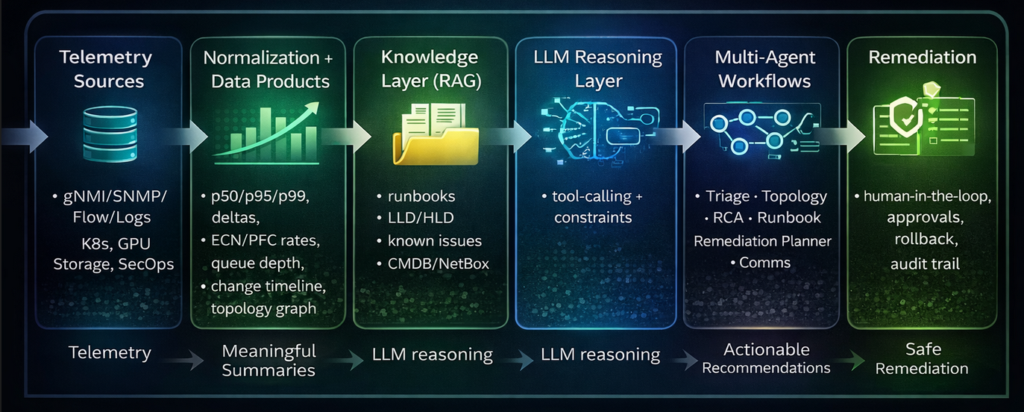
In practice, successful deployments follow the same architecture pattern.
Telemetry still comes from familiar sources: streaming network data (gNMI), device health (SNMP), flow records, syslogs and events, plus platform signals from Kubernetes, GPU metrics, and storage performance. The difference is what happens next. Before an LLM ever sees the data, you build “data products”, compact operational summaries that preserve meaning while removing noise.
This is where metrics like p50/p95/p99 become essential. Average latency might look fine while p99 tells you users are suffering. ECN marking rates can surface congestion earlier than drops. PFC pause frames and pause duration are critical in RoCE environments because “no loss” does not mean “no problem.” Buffer occupancy and queue depth tell you where congestion forms and which traffic class is being impacted. These signals are far more actionable than a long list of counters.
Once you have these summaries, the LLM can reason reliably because it’s working with evidence rather than a firehose. Add retrieval (RAG) so it can consult your LLD/HLD, your “design intent” notes, your SOPs, and your postmortems. Now the model isn’t inventing an answer, it’s reconciling observed facts with the way the system is supposed to behave.
Finally, you wrap this in workflow guardrails. Recommendations should be human-in-the-loop by default, with approvals and rollback plans for any change. That’s how you make the system deployable in real enterprises: sovereignty, safety, and auditability are not optional features, they are the product.
Why AI fabrics demand this kind of reasoning
AI infrastructure introduces failure modes that don’t always announce themselves with obvious alarms. A GPU fabric can be “up” while training throughput collapses due to congestion reaction, microbursts, or a localized hot spot. A storage system can look healthy while p99 latency quietly climbs and jobs back off. Kubernetes can keep the control plane running while a CNI issue triggers intermittent reachability for a subset of nodes. Security controls can do their job perfectly and still become the hidden cause of an outage after a policy update.
The common thread is that the symptom appears in one domain while the cause sits in another. Operators spend hours correlating by hand because the tools don’t speak a shared language. A locally deployed LLM can become that translation layer connecting topology, time windows, and cross-domain signals into a story that’s operationally useful.
What “good” looks like: evidence-backed incident narratives
The fastest way to understand the value is to imagine a familiar incident: training slows down and “nothing is down.”
In a traditional workflow, the network team checks interface counters and routing adjacency, the platform team checks node status, the storage team checks latency, and the application team checks NCCL health. Everyone has a partial truth. Time is lost stitching these partial truths into a single causal chain.
In an LLM-assisted workflow, the outcome you want is a disciplined narrative. The model should summarize what changed, isolate where the impact is concentrated, and explain what evidence supports the top hypotheses.
For example, it might find that ECN marking rose sharply on uplinks of a particular leaf switch at the same time training throughput dropped. It may observe buffer occupancy growth on a specific queue, with PFC pause frames rising for a single priority. It may check that storage p99 latency remained stable, reducing the likelihood of a storage-driven slowdown. It may correlate the affected GPU nodes to a specific rack group that maps to those leaf uplinks. At that point, the model is not guessing it’s building a case.
The output should then recommend the fastest discriminators: check optics and FEC/CRC deltas, validate ECMP distribution, inspect pause counters per priority, and compare per-uplink utilization variance to detect path imbalance. If remediation is proposed, it should be presented with risk and rollback. Draining a suspect link temporarily is lower risk than changing QoS thresholds. A safe plan is explicit about what will be observed if the hypothesis is correct and what to do if it isn’t.
That style of output changes operations. It reduces alert fatigue because the model compresses noise into a single incident thread. It shortens MTTR because investigations start with the most informative checks. It also standardizes response across teams and shifts because the reasoning is documented and auditable.
Why multi-agent workflows help in real deployments
One of the traps in this space is building a single “super prompt” and expecting it to behave like a reliable operator. In practice, incident response is multi-step work performed by specialists: someone looks at topology, someone pulls telemetry, someone runs a protocol-level check, someone maps findings to a runbook, someone drafts comms.
Multi-agent workflows mirror that reality. A telemetry agent can focus on extracting time-windowed deltas and building evidence packets. A topology agent can map blast radius and dependencies. A hypothesis agent can rank likely causes and specify what would confirm or deny each. A runbook agent can retrieve approved procedures. A remediation planner can propose reversible steps. A comms agent can write an incident update that’s consistent and clear.
The point isn’t complexity for its own sake. It’s governance. When each agent has a constrained role, you can test and audit them more easily. You can also prevent “creative leaps” by requiring every conclusion to cite evidence and every action to map to an approved method.
Security and sovereignty: the quiet reason this matters to customers
For many enterprises, the biggest blocker to adopting advanced AI for operations isn’t the idea, it’s the data. Incident logs can contain sensitive identifiers. Network configurations encode business logic. Flow data can reveal internal structures. Exporting that outside the boundary can be unacceptable.
An on-prem deployment changes the trust model. You can keep telemetry, configs, and runbooks local. You can store prompts and tool outputs in your own audit systems. You can enforce RBAC and approvals through your existing identity layer. And you can decide exactly what the model is allowed to see, retrieve, and do.
This is how “LLM for ops” becomes a practical enterprise capability rather than an experiment.
A realistic adoption path
It’s worth saying plainly: “autonomous” doesn’t have to mean “unsupervised.” The fastest path to value is usually a phased rollout.
Start with read-only assistance that summarizes incidents, builds timelines, and recommends next checks. Then graduate to runbook guidance, where the model retrieves approved procedures and walks operators through them step-by-step. Once trust is built, you introduce gated remediation where the model proposes actions but requires approvals, and every action includes a rollback plan. Only after that do you automate the lowest-risk, reversible tasks.
Customers get meaningful improvement early without waiting for full autonomy.
Closing: why this matters for AI platforms
AI infrastructure amplifies the cost of operational delay. Training time is expensive. GPU resources are scarce. Workloads are sensitive to tail latency, congestion reaction, and subtle faults that don’t show up as hard failures. The answer isn’t more telemetry. The answer is better reasoning over telemetry.
A locally deployed LLM, combined with strong data products, retrieval of internal knowledge, and safe governance, can become the missing layer between dashboards and decisions. It can reduce alert noise, accelerate RCA, and standardize remediation across network, Kubernetes, GPU, storage, and security while keeping data inside the customer boundary.
If you’re evaluating this approach, the best starting point is not “Which model should we run?” but “What evidence packets do we need?” Once you can reliably transform raw signals into operational facts, the reasoning layer becomes both more accurate and more trustworthy and the path from telemetry to remediation gets shorter.

Oluwatosin Aramide
Senior Network Engineer