To evaluate the inference capabilities of a large language model (LLM), we focus on two key metrics: latency and throughput.
Latency
Latency measures the time it takes for an LLM to generate a response to a user’s prompt. It is a critical indicator of a language model’s speed and significantly impacts a user’s perception of the efficiency of a generative AI application. The calculation for latency is as follows:
Latency per user = Total duration – Time to first token
- Total duration: The total time taken to generate the answer, including the time required to process the input.
- Time to first token: The time it takes for the user to start receiving a response from the model after entering their prompt. This includes the time needed to process the user’s input and generate the first completion token.
System latency can be calculated as:
Latency = Average latency for all concurrent users (batch size)
Throughput
Throughput refers to the number of output tokens per second that an inference server can generate across all users. It is calculated as follows:
Throughput per user = Number of tokens generated by user / Latency per user
System throughput = Total number of tokens generated for all users / Average latency for all users
Simulating the Experiment
To simulate real performance, we send concurrent requests to the inference server.
we monitor each request stream and calculate the total number of tokens generated and then
calculate the above metrics (latency and throughput). We then plot these graphs:
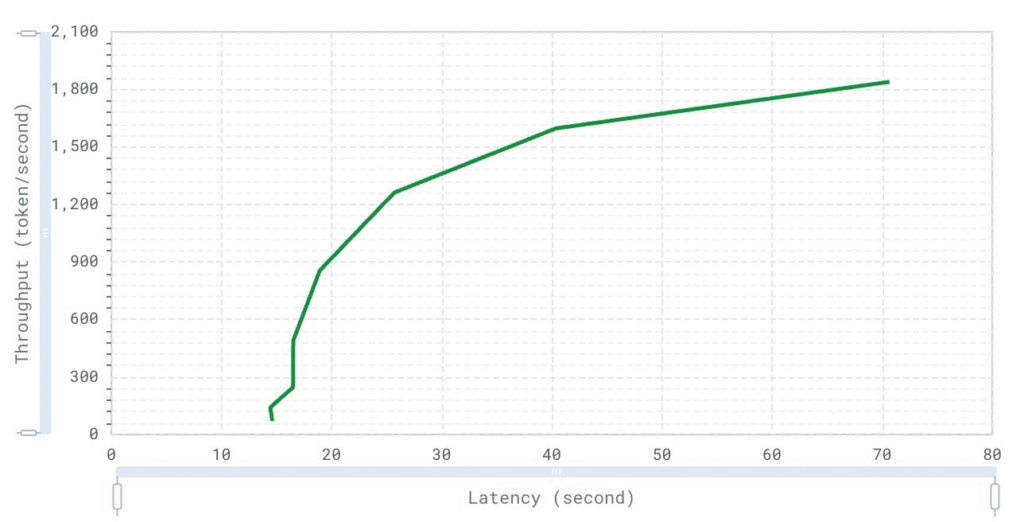
System Throughput over Latency
This graph is useful for understanding the trade-off between latency and throughput. By examining this relationship, we can set realistic expectations for performance under varying conditions. It helps in optimizing system configurations to achieve a balance between latency and throughput, ensuring that neither metric degrades excessively.
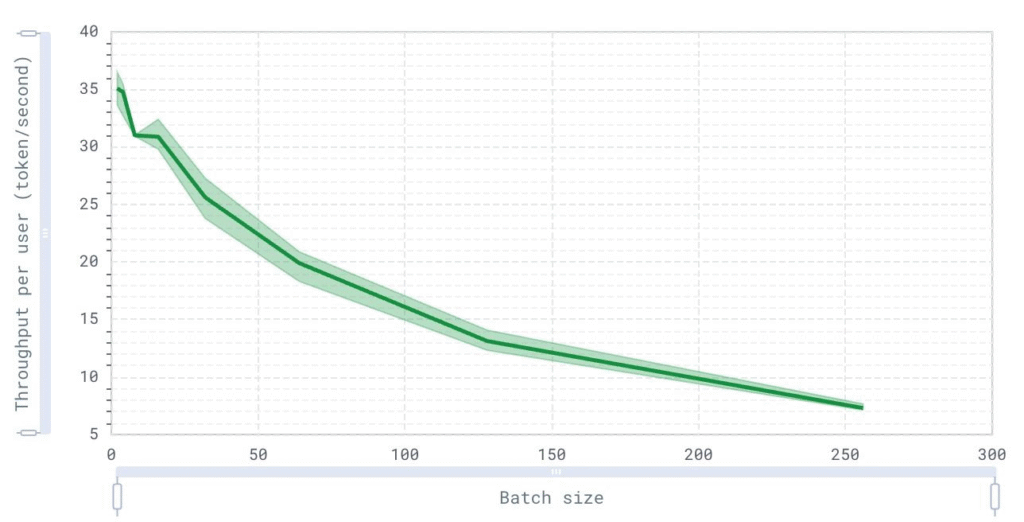
Throughput per user over batch size (user)
Interpreting this graph allows us to understand the impact of scaling on individual user performance. It highlights how user experience changes with different batch sizes, guiding decisions on batch size limits to ensure fair resource distribution and maintain acceptable performance levels for individual users.
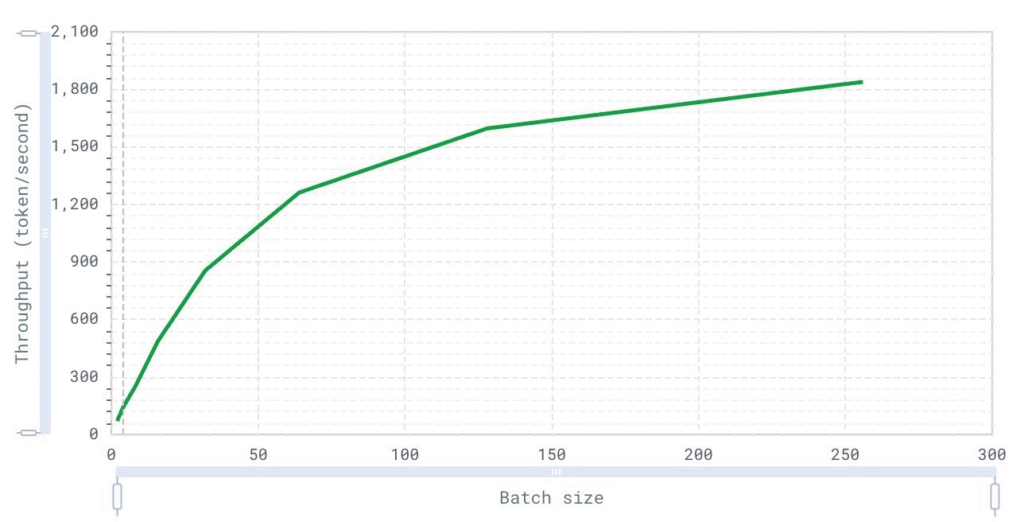
Throughput over batch size (user)
This graph represents the overall throughput of the system as the batch size increases. It provides insight into the system’s capacity to handle multiple requests simultaneously and its efficiency at different scales.
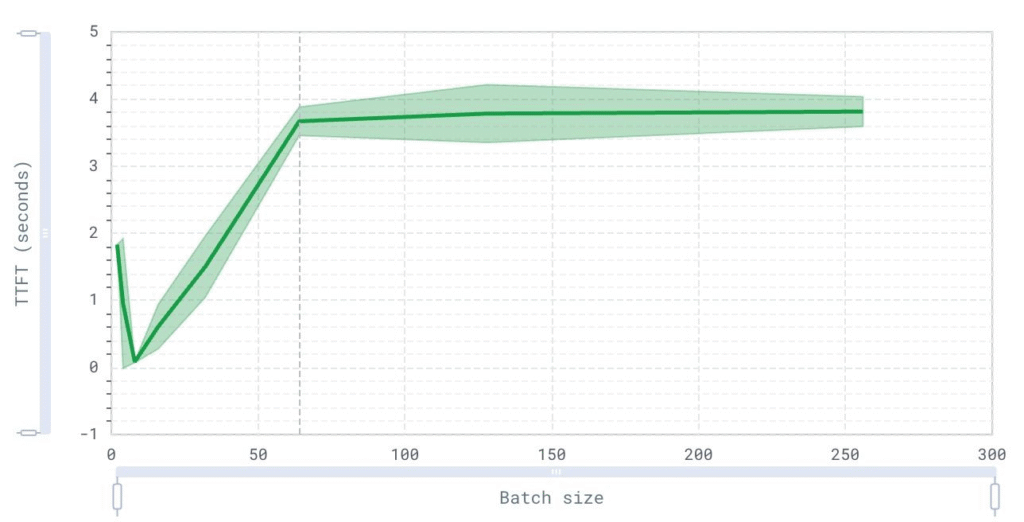
Time to first to token over batch size (user)
The TTFT graph helps in evaluating the initial responsiveness of the system under varying loads. This is crucial for user experience, especially in interactive applications. By analyzing this graph, we can identify the optimal batch size that maintains a quick initial response, thus improving user satisfaction.
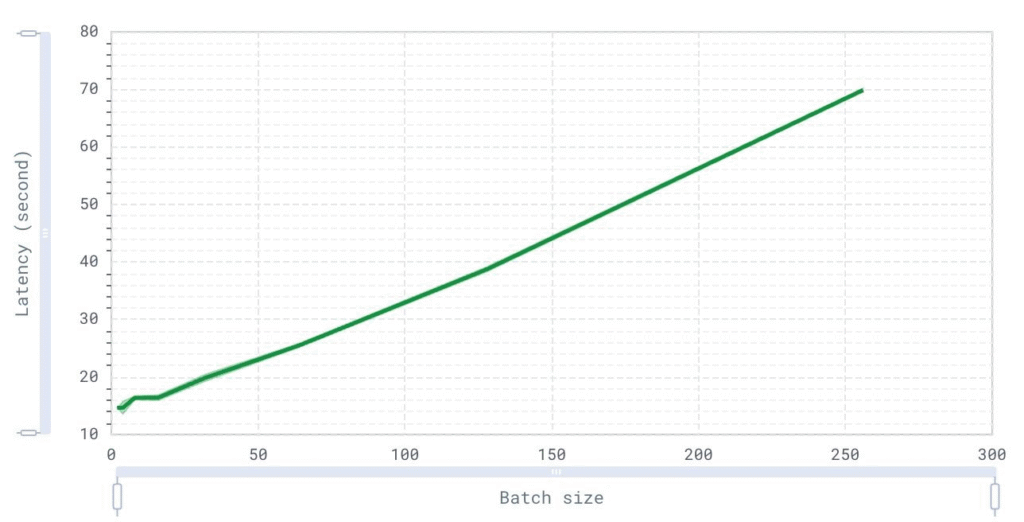
Average latency over batch size (user)
This graph provides critical insights into system performance as load increases. By analyzing the trend, we can determine the maximum batch size the system can handle before latency becomes unacceptable.